
Product Design · Human Factors
The environment is
part of the interface
The work here asked a researchable question: when information lives in three dimensions around a person, what changes in how they understand it, feel it, and act on it. The answer came from controlled experiments, not assertion.
METHOD
Build, then measure with controlled studies
ROLE
Research lead, prototype designer, in-VR interaction design
OUTPUT
Peer-reviewed studies · VR clinical simulator · 1 field study
PLATFORMS
Head-mounted displays · mixed reality · stereoscopic desktop VR
- The through-line 01 / 07
Five projects, one question
Across a virtual operating room, a retail-product study, a media-richness experiment, eye-tracking with practicing radiologists, and a survey of working designers, the same theme kept surfacing: spatial context is not decoration around the real interface. It is the interface. The work moved from building immersive environments, to measuring how those environments changed user response, down to tracking attention at the level of the eye, to understanding why design teams were slow to adopt the tools that made this possible.
Build
Mechanism
Comparison
Attention
Adoption
VR Operating Room
U. Missouri Immersive Visualization Lab
Presence mediates UX
HMD and desktop VR experiments
Spatial overlay vs flat media
Print / AR / mixed reality
Eye-tracking in clinical reading
Healthcare technology partnership
Why designers don't adopt
Field study, 54 practitioners
Build
VR Operating Room
U. Missouri Immersive Visualization Lab
Mechanism
Presence mediates UX
HMD and desktop VR experiments
Comparison
Spatial overlay vs flat media
Print / AR / mixed reality
Attention
Eye-tracking in clinical reading
Healthcare technology partnership
Adoption
Why designers don't adopt
Field study, 54 practitioners
- Spatial UX 02 / 07
Five projects, one question
New residents and operating-room staff had to learn an unfamiliar, equipment-dense space from detached materials: manuals, lectures, static diagrams. None of those convey the thing that actually matters in an OR, which is where everything sits in relation to everything else, and to you.
Co-created with a department of anesthesiology, this simulator turned room layout, equipment, and procedural workflow into something staff could practice inside. Stereoscopic 3D for depth. Controller-driven navigation for movement. The space itself did the teaching.
Functional VR prototype, not a concept render.
A working, navigable environment that ran on real hardware and was used by real clinical staff.
Operating-room workflow modeled in 3D.
Bed, lights, anesthesia cart, monitors, and supply zones positioned to procedural reality and modeled to scale.
Embodied interaction.
Controller-driven navigation let users move through the scene and learn spatial relationships by doing, not by reading.
Role: 3D modeling, in-VR UI, and interaction design.
Co-created the simulator inside the Immersive Visualization Lab.
University of Missouri, Immersive Visualization Lab. Funded in part by the MU ITC Innovation Fund, "VR for Healthcare Training."

Stereoscopic operating-room environment, captured in the headset.
Stereoscopic operating-room environment, captured in the headset.
Sustainability information overlaid in head-mounted mixed reality.
Flat baseline
TABLET AR
Tablet overlay
HMD MR
Most informative
- Spatial UX 03 / 07
Spatial overlay outperformed flat media for product information
When someone evaluates a product, the information that shapes their judgment arrives through whatever medium happens to carry it: a printed sheet, a tablet screen, or content anchored in space around the object itself. This study tested all three with the same product and the same content, in a three-condition within-subject design. Print versus tablet AR versus head-mounted mixed reality.
The spatial condition, where information was overlaid and anchored to the product in the user’s real field of view, was significantly more informative than print. The medium was not neutral. Where the information lived changed how well it landed.
Three-condition within-subject design.
Every participant experienced all three media, so differences came from the medium, not from who was assigned to what.
Print vs. tablet AR vs. head-mounted MR.
Same product, same sustainability content, three delivery formats.
Head-mounted MR was significantly more informative than print (p < .05).
Anchoring information to the object in real space beat the flat sheet.
Role: ran the study and co-built the 3D content.
Conceptual bridge
This connects to a deeper question. If the medium changes
response, why? The next study isolates the mechanism.
- Spatial UX 04 / 07
- Peer-reviewed
Why it works: presence mediates the experience
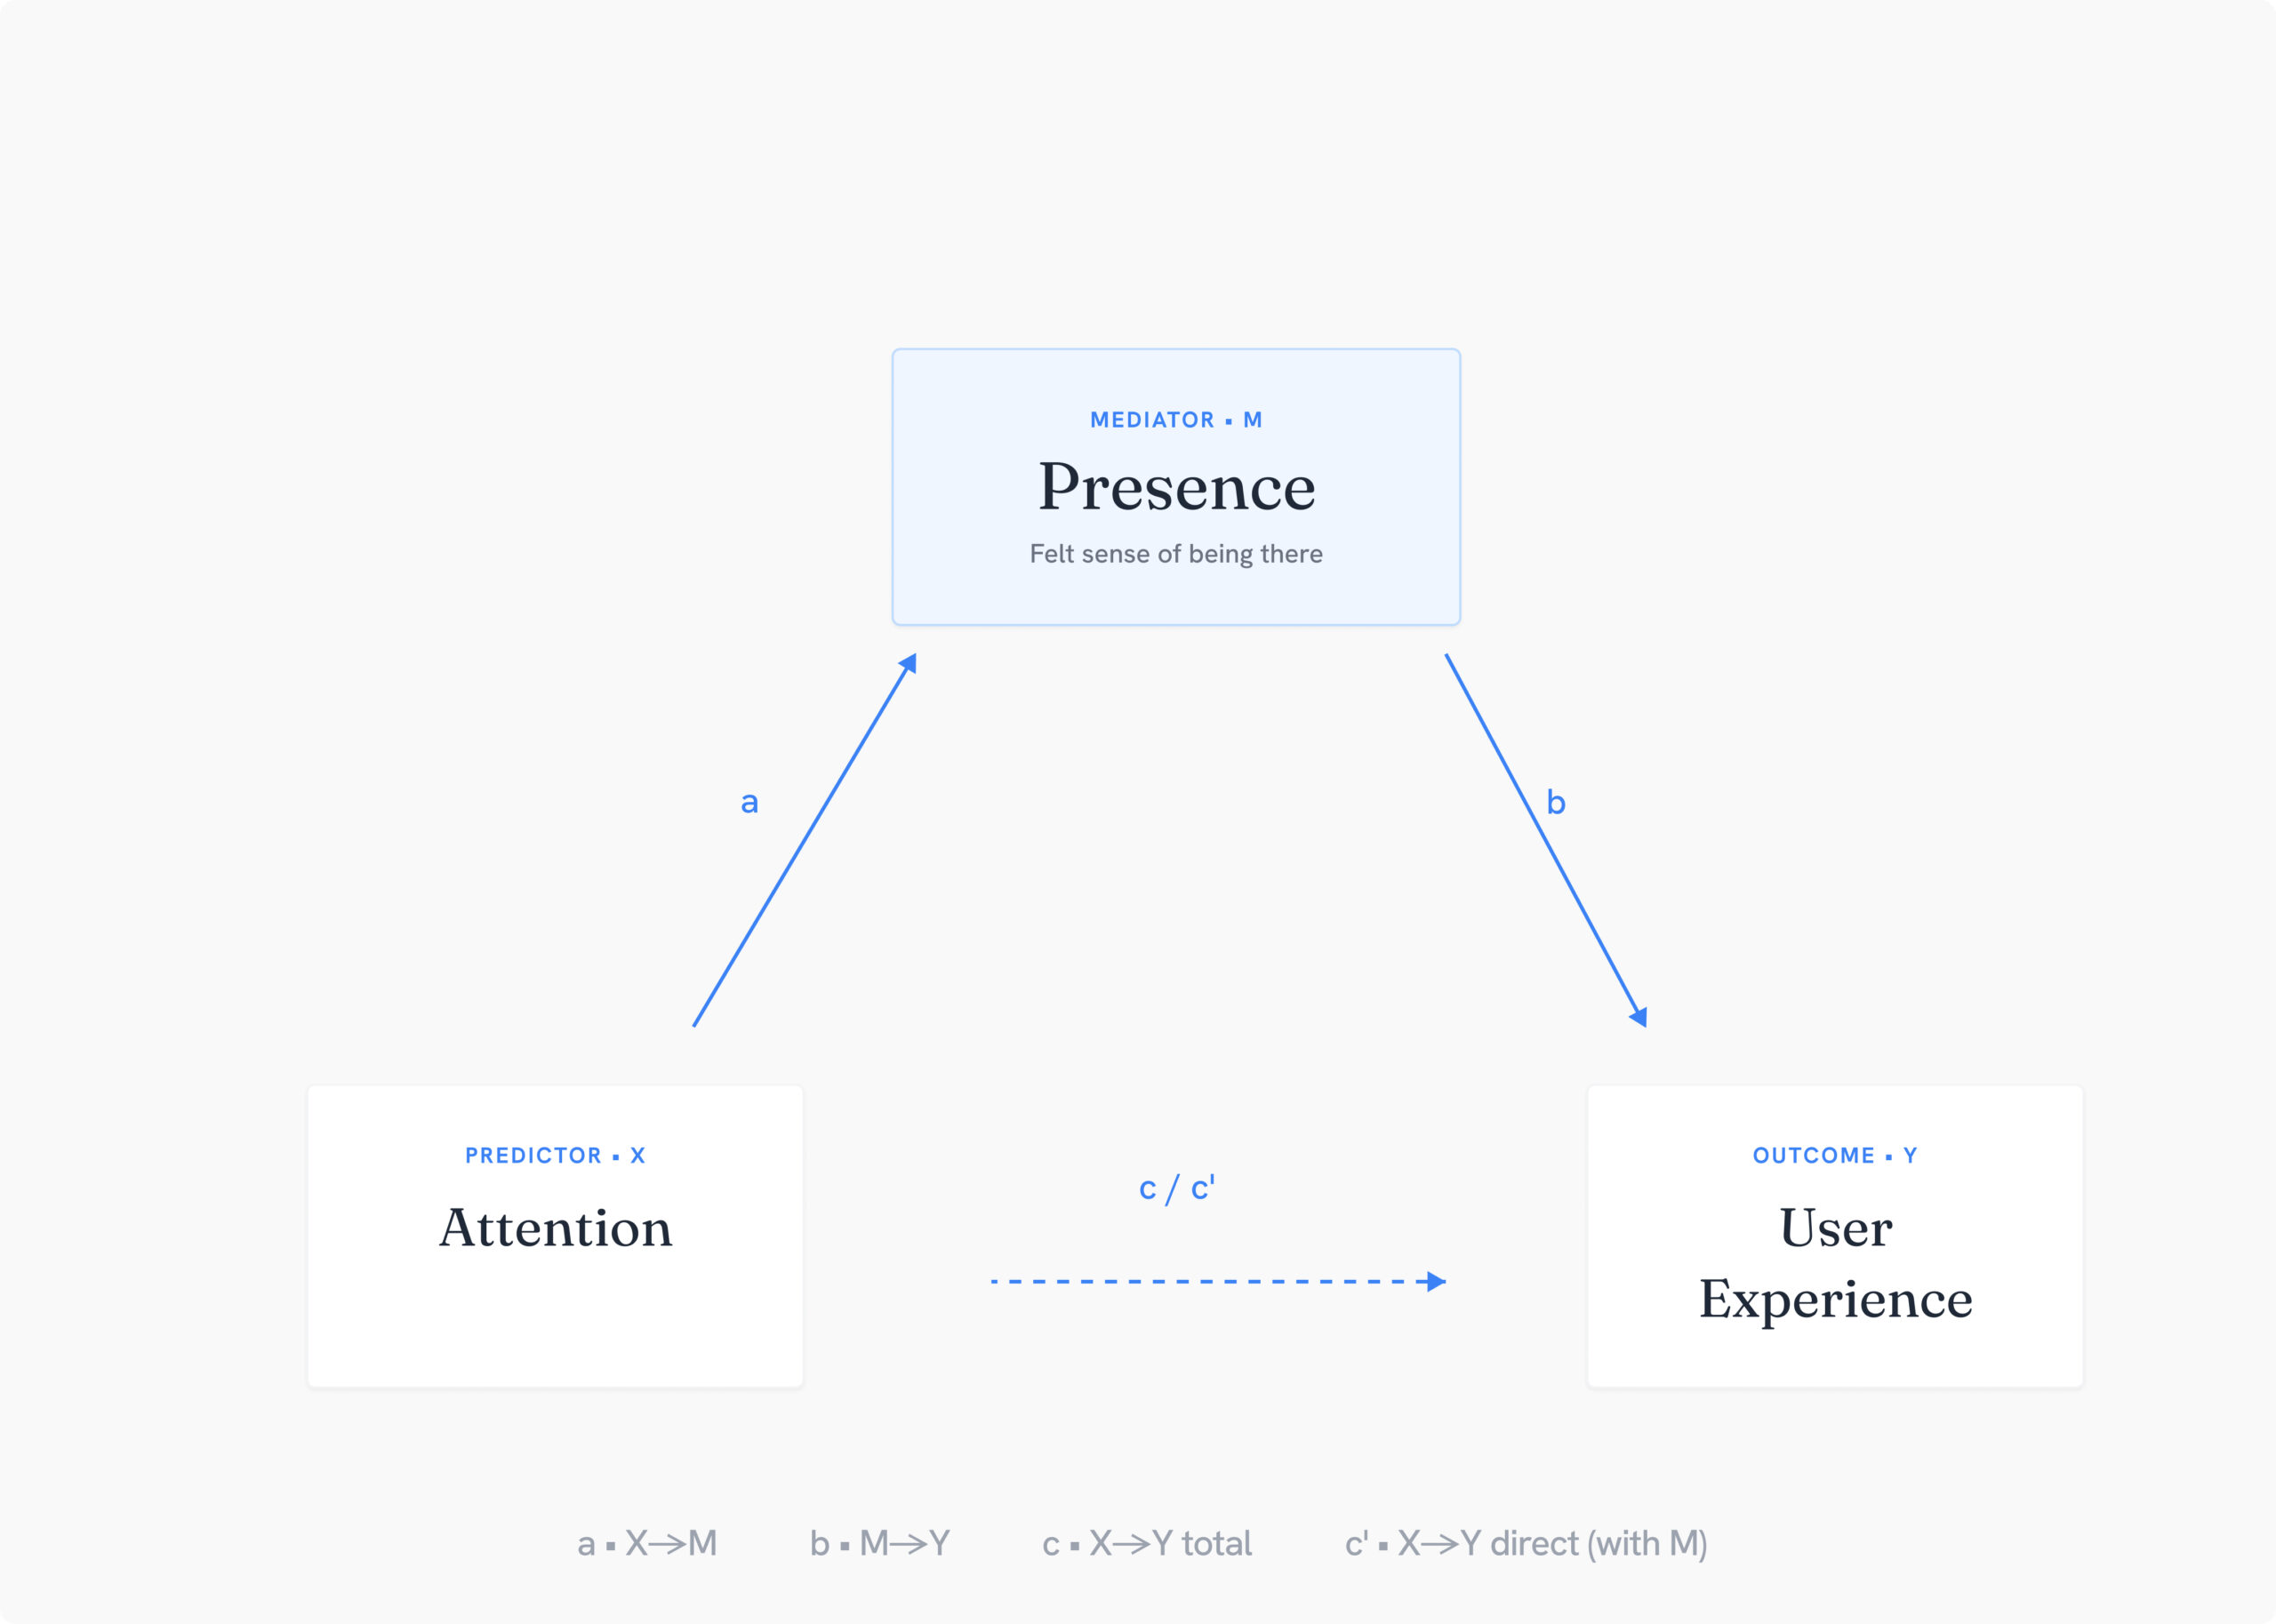
Spatial media changes user response, but the design question is the mechanism. What is the lever. This study ran two parallel experiments, one in a fully immersive head-mounted display and one in desktop VR, using the same high-fidelity retail environment built in SolidWorks, 3ds Max, and Unity. The model under test: attention shapes user experience, but indirectly, through a user’s sense of presence, the felt sense of being there.
Across both display types, presence partially mediated the effect of attention on experience. Richer, more immersive presentation improved response, but only when the environment itself supported what the user was trying to interpret. This is the published, peer-reviewed core of the thesis: the environment is not a backdrop to the interface. It is a working part of it.
Two experiments, two display types.
Fully immersive HMD (stereoscopic 3D) and 2.5D desktop VR, to test whether the finding held across platforms.
Presence mediates attention's effect on experience.
Confirmed by regression analysis and Sobel test in both studies.
Published, peer-reviewed.
Naderi, Balakrishnan, and Khosravi, presented at HCI International.
Role: research lead and prototyper. Published with co-authors.
Parallel head-mounted and desktop VR retail experiments.
Mediation model
STUDY 1
c · X→Y total
c′ · X→Y direct
b · M→Y
Sobel
z = 2.19 · p = .029 · partial mediation
Reliability α
UX .89 / Pres .96 / Att .75
VIF
1.06 · no multicollinearity concern
STUDY 2
c · X→Y total
c′ · X→Y direct
b · M→Y
Sobel
z = 2.21 · p = .027 · partial mediation
Reliability α
UX .92 / Pres .96 / Att .84
VIF
1.06 · no multicollinearity concern
Read simply
Attention improves experience, but a large part of that effect runs through presence. When immersion deepens the felt sense of being there, the experience improves. When it doesn’t, attention alone does less work.
- Decision under constraint
Choosing how much
immersion to test
- The constraint
A head-mounted display gives the strongest depth and the strongest sense of presence, but headsets cause discomfort and fatigue, cap how long a session can run, and rule out some participants on fit and comfort. Desktop VR is comfortable and accessible, but the felt sense of being there is weaker. The study could not assume one display stood in for the other.
PATH 1
Immersive headset only
Maximum presence and depth, but short sessions, a comfort and accessibility cost,
and a smaller eligible sample.
PATH 2
Desktop VR only
Comfortable, accessible, and repeatable with longer sessions, but a
weaker felt sense of being there.
PATH 3
Both in parallel
Two studies instead of one, at the cost of more to build and analyze, but
a result that holds across fidelity levels.
The call
Run both display types in parallel and test whether presence mediation holds across fidelity, instead of betting the finding on a single platform. If the effect showed up in immersive and desktop conditions alike, it was a property of presence, not of one headset.
The mitigation
Keep immersive sessions short, screen participants for comfort, and treat desktop VR as the accessible path that still shows the effect. The cost was real: two studies to build and run instead of one. The payoff was a finding that did not depend on a single device.
- Spatial UX 05 / 07
- Confidential client work
ROLE
METHOD
Within-subject, eye-tracking with gaze replay
EVIDENCE
ANOVA, chi-square, scanpath, heatmaps
DECISION
Findings mapped to shipped interface changes
Eye-tracking that turned gaze into design decisions
On a large healthcare technology partnership building a next generation medical imaging platform, the open question was not what clinicians said about the interface. It was where they actually looked, and what that revealed about how well the screen supported their work.
The study used eye-tracking with practicing radiologists to measure attention directly: what they noticed, what they missed, what slowed them down, and where the interface created confusion. Every finding tied back to a specific, testable design change. This was attention measured at the level of the eye, then translated into decisions a product team could ship.
Attention measured directly, not self-reported.
Eye-tracking captured real gaze behavior from practicing radiologists working through realistic reading tasks.
Within-subject study with layered methods.
Quantitative usability testing with measured gaze metrics, qualitative gaze-replay analysis, and pre and post task satisfaction surveys.
Findings became design decisions.
Each result mapped to a concrete change: reordering information, shifting emphasis, fixing a confusing control, adjusting contrast for readability.
Role: designer and researcher.
Planned the study, ran the sessions, analyzed the data, and turned the findings into recommendations the product team could act on.
Eye-tracking session with practicing radiologists. Interface details withheld for confidentiality.
Eye-tracking results
ANALYSIS OF VARIANCE
Interface A · region importance
Interface B · region importance
Attention was not uniform. Some screen regions mattered far more than others.
CROSS-METHOD CHECK
Gaze vs self-reported noticeability
Gaze behavior was tested against self-reports. The gap was significant on at least one element. Eye-tracking caught what surveys alone would miss.
Study scope and methods
PARTICIPANTS
SCOPE
5 radiology specialties, two experience groups: 5 to 9 years and 15 or more
EYE-TRACKER
30 to 60 Hz sampling, 0.5 to 1 degree accuracy
ANALYSIS
ANOVA, Tukey HSD, t-test, chi-square, scanpath protocol, heatmaps. Satisfaction by SUS and CSUQ
Reading patterns the gaze revealed
Mirrored F-shape on one surface
Gaze concentrated along the top and the leading edge, then dropped off. A predictable scan path that tells you exactly where to place what matters most.
Segregated reading on another
Attention split into separated zones instead of a single path, a sign the layout was fragmenting the read and forcing extra work.
Read simply
One workstation surface was analyzed and synthesized faster than another. Eye-tracking mapped where attention concentrated, where it broke, and where the workflow could be reconnected for faster, more accurate reads. Each finding became a specific change the product team could act on.
- Driving simulator
The same focus on attention extended to a safety-critical setting: a funded driving-simulator study of how drivers behave when their attention is split, for example between the road and a phone. Divided attention is not an abstraction behind the wheel. It changes what a driver sees, misses, and reacts to, and the research looked at how road and interface design shape that. It is the same core question as the rest of this work, asked where the stakes are highest.
Across both display types, presence partially mediated the effect of attention on experience. Richer, more immersive presentation improved response, but only when the environment itself supported what the user was trying to interpret. This is the published, peer-reviewed core of the thesis: the environment is not a backdrop to the interface. It is a working part of it.
Divided-attention research in a driving simulator.
- Spatial UX 06 / 07
- Second-order finding
If spatial tools work, why don't design teams use them?
Building immersive prototypes and proving they change user response raises an obvious follow-up. If the tools are this useful, why are design firms so slow to adopt them. This mixed-methods study, conducted at an 80-plus-person office of a large design and engineering firm and published at the International Conference on Engineering Design, went looking for the barriers. A focus group surfaced them; a survey of 54 practitioners measured them.
Building immersive prototypes and proving they change user response raises an obvious follow-up. If the tools are this useful, why are design firms so slow to adopt them. This mixed-methods study, conducted at an 80-plus-person office of a large design and engineering firm and published at the International Conference on Engineering Design, went looking for the barriers. A focus group surfaced them; a survey of 54 practitioners measured them.
Mixed methods.
Focus group to find the barriers, survey of 54 practitioners to measure them.
Internal barriers outweighed external ones.
Perception and managerial framing mattered more than hardware or budget.
Experience and willingness did not predict attitude.
A regression found neither years of experience nor willingness-to-learn was a significant predictor, challenging the assumption that junior staff adopt faster.
Role: co-led the research. Published at ICED, Delft.
Part A
Comfort producing output, share of practitioners
Practitioner comfort, by output type. The more spatial the medium, the fewer designers feel comfortable producing it.
Part B · Where the barriers live
Designer perception of VR, AR, and MR
Manager attitude toward integration in design service
Perception and managerial framing, not hardware, set the ceiling on adoption.
Hardware and software availability and reliability
Training programs
Funding
Managerial support
In-house champions
Technical support
Regression finding
Years of experience was not a significant
predictor of adoption attitude.
p = n.s.
Adoption resistance is organizational and perceptual, not generational.
- Synthesis 07 / 07
What this establishes
Taken together, these projects form a single argument made five ways. Spatial context is a functional part of the interface, not a frame around it. The work proved it constructively, by building a clinical simulator people learned inside, and empirically, by isolating presence as the mechanism that makes immersive media work and by showing spatial overlay beating flat media on the same content. It carried the same question down to the movement of the eye, using eye-tracking to turn what clinicians looked at into design decisions a product team could ship, and out into safety-critical driving, where divided attention changes what a person sees and misses. The adoption study then turned the lens on the field itself, naming why teams underuse tools that demonstrably help. This is the foundation the rest of the portfolio builds on: a designer who treats the environment, and attention itself, as variables to be tested, and who pairs prototypes with the evidence that justifies them.
What it protects and enables
This research capability catches attention and comprehension failures before they ship, and turns interface debate into measured decisions. The methods that validated these spatial interfaces carry directly into regulated devices and into software used at large scale. That is the throughline of the work: product design and human factors, from medical devices to products used by millions.
What it costs to do properly
Controlled studies take time, real participants, and honest analysis. It means running accessible conditions next to high-fidelity ones, and being willing to let the data overrule the prettier design. Done properly, it replaces opinion with evidence at the point where a decision is expensive to reverse.
The environment is
part of the interface.
Record
PUBLICATIONS
COLLABORATORS
U. Missouri Immersive Visualization Lab · U. Missouri Medical School · U. Minnesota VR Lab
FUNDING
TOOLS
SolidWorks · 3ds Max · Unity · head-mounted displays · mixed reality